Project Overview
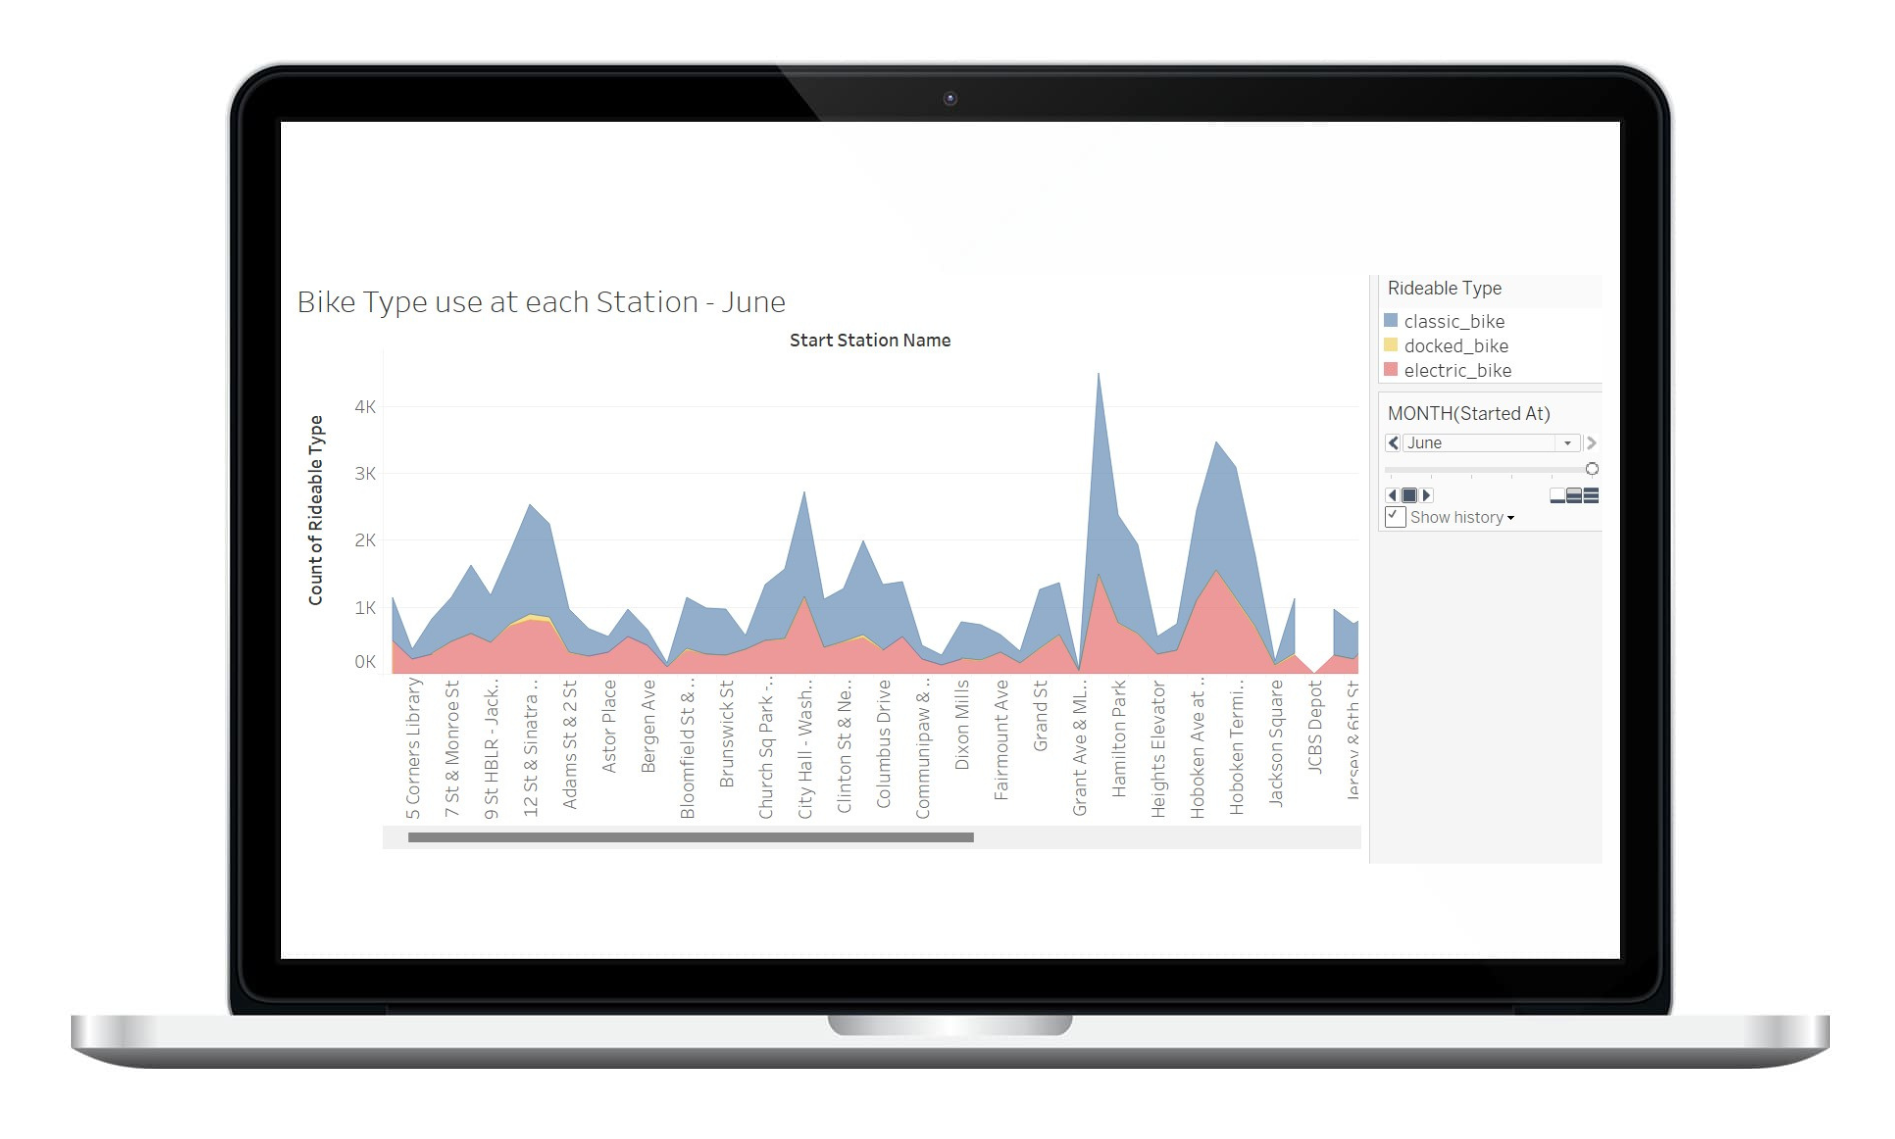
With the recent 2021 expansion of the NYC Citi Bike ride-share program into Jersey City, it is important to gain insights into station use, bike type use, membership use, and casual bike ride use. The focus of this analysis is to look at Jersey City Bike Station data and explore these considerations through stations. Looking at the last 6 months (January- June 2022) of Jersey City Citi Bike data, this presentation explored trends for bike station popularity, ride-type preference, and membership use. This presentation was created using Tableu.
Cleaned and merged 6 months Citi Bike data using Pandas in Jupyter Notebook.

