Project Overview
Data Sources
We used four datasets for this analysis- datasets 1-2 contain UFO sighting data while datasets 3-4 contain data for the features used in our machine learning algorithm:
Nuforc- National UFO Research Center collects and serves over 100,000 reports of UFO sightings LINK
UFO dataset from Medium.com- dataset that contains UFO sightings of the last century in the USA and the rest of the world LINK
Historical State Population- combination of individual files published by the Federal Reserve Bank of St. Louis that each contain annual population numbers for all 50 states & DC from 1900-2017LINK
Computational Power- dataset of change in supercomputer computational power from 1990-2021 LINK
ETL
Extract: we pulled and downloaded our datasets from Kaggle and Github repos and loaded to a jupyter notebook.
Transform: after loading our datasets, we cleaned the first two containing UFO sighting data by dropping null/NaN values and duplicates. We also dropped Hoax and duration data as the intake/input of this data was inconsistent and could not be cleaned in a reasonable time to be used for analysis. Once cleaned, we merged the two UFO sighting datasets by concatenating the two data frames and completing an inner join.
Load: because the final csv was so large, we stored it in an S3 bucket on AWS and used PySpark in Google Colab to pull for future analysis. (https://ufodatagt.s3.amazonaws.com/Complete_UFO_data+(7).csv)
Machine Learning
Goal: The goal of our analysis was to predict the number of UFO sightings in the next 80 or so years until 2100 for two dimensions:
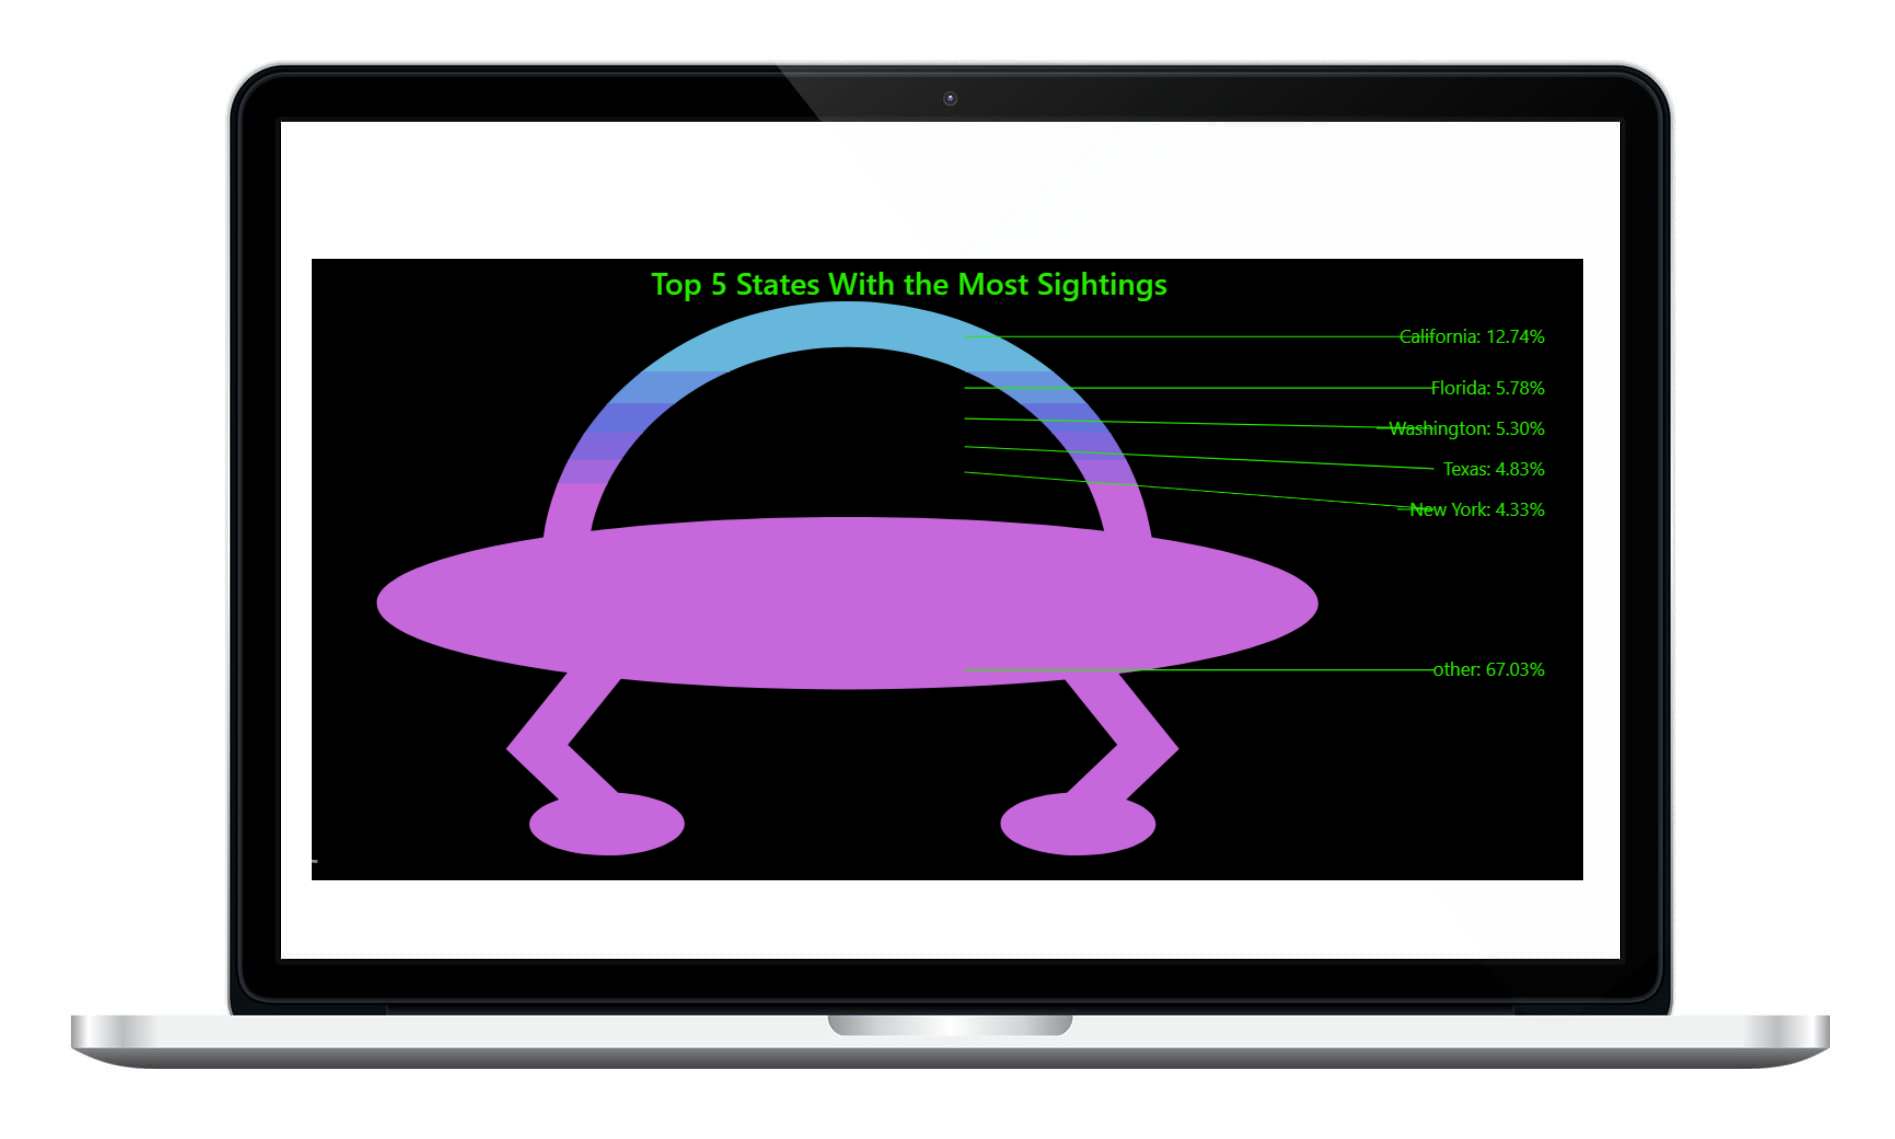
the current top 5 states for UFO sightings & the current top 5 reported UFO shapes.,
We identifed the top 5 states and shapes for UFO sightings from our cleaned dataset using the value_counts method and created the dataframe to use for machine learning by apply a binary coding system to our data set that indicated whether a sighing was in one of the top 5 identified states or shapes. We then applied the groupby method to the binary coded dataframe to count the number of sightings in the top states and shapes each year we had data for.
Method:
We used Supervised Learning, specifically linear regression, to determine which of our two features would be better at predicting UFO sightings- population or supercomputer computational power.
Our hypothesis was that supercomputer computatinoal power would be a better indicator of UFO sightings and would lead to a more accurate machine learning algorithm.
With the train_test_split and LinearRegression dependecnices from the sklearn library, we actually found the opposite- population had a higher training and test score than computational power, indicating it would be a better predictor of future UFO sightings.
Thus, because our regression analysis found population to be a better indicator, we used a population growth rate of 0.01% per year, defined a function to spit out the number of sightings in the next 80 years into a dataframe and then plotted that dataframe using Tableau.
*Note: Google estimates future population growth to be around 0.03% but the logrithmic factor inherent in this number created problems in our function, thus we used a smaller growth factor of 0.01%.
Conclusions and Predictions
Conclusions:
Population growth is a better indicator of UFO sightings than computational power.Caution: It is not surprising that population size/growth is related to number of UFO sightings, simply because more people means more people to report sightings. Perhaps this features should be combined with additional features in an unsupervised model for future analysis.However, both population growth and computational power had low test scores from the linear regression, indicating perhaps better, more related features exist.
Predictions:
Using a population growth rate of 0.01% per year, we see a proportional increase in UFO sightings in each state and in each shape regardless of location. (Our Tableau charts show this general upward trend for the current top 5 states and shapes, but we predict the same trend would apply to other states and shapes where/for there are current sightings).
Based on the 0.01% population growth rate, by 2100, we predict:
5,000 UFO sightings will be reported in California, the state with the highest reported sightings
10,000 UFO sightings will be reported in the shape, Light, the shape with the highest reported sightings
Limitations + Further Considerations
Limitations:
Data cleanup- a lot of data in the original datasets were comments or sighting notes from those who saw the UFO and thus could not easily be cleaned
Data inconsistencies- different datasets had different column headers and looked at different data- this meant we had to drop a lot of columns that could have been helpful for predictions
Lack of additional features/indicators for our linear regression model limited accuracy in predictions
More time
Future Considerations:
Use different models for increased accuracy in predictions- Time-Series Analysis in ML
Find additional, related features to increase accuracy
Analysis of recently released documents of the government
If more time, consider further Questions: What % of future UFO sightings would be in a specific city or during a selected month?
Leverage advanced ML to filter out obvious hoaxes

