


Project Overview
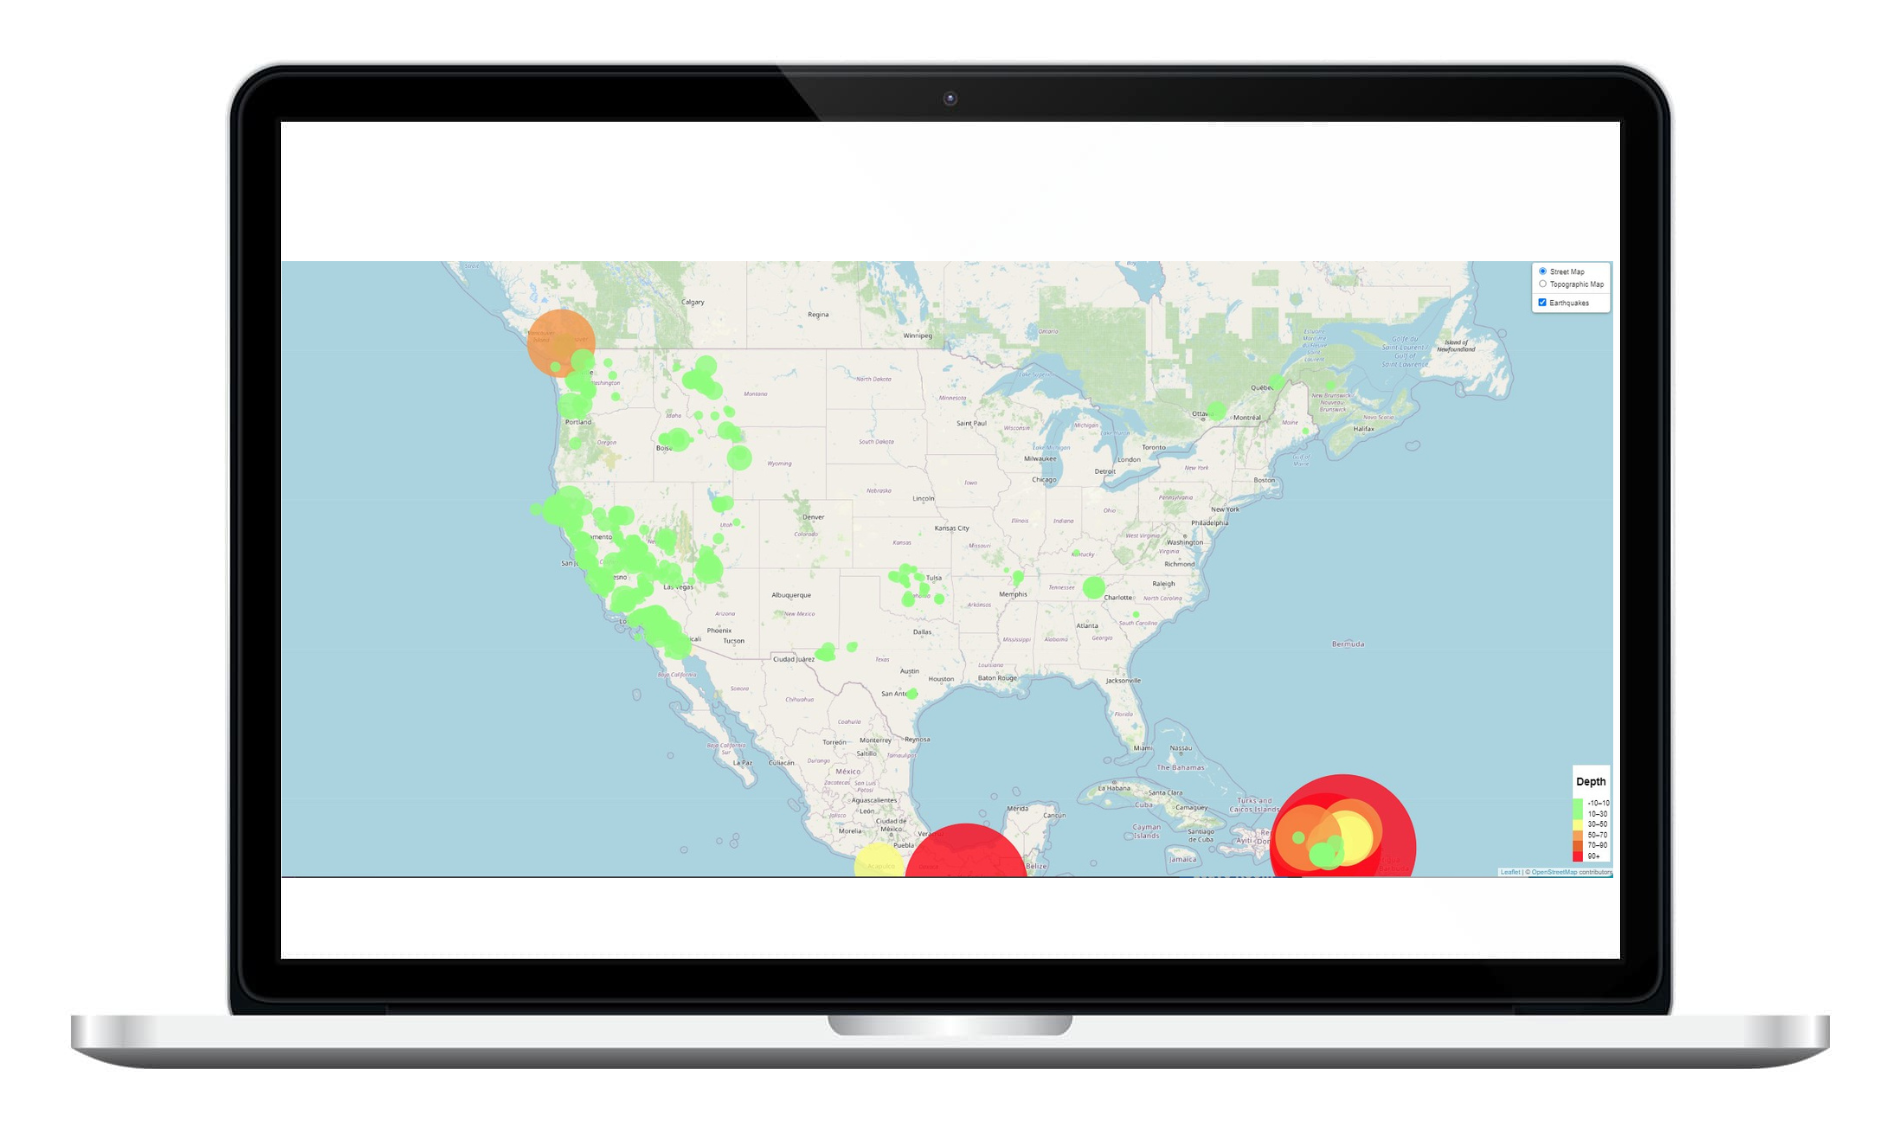
Imported and visualized the data by using Leaflet, created a map that plots all the earthquakes from the GeoJSON based on their longitude and latitude based upon the depth of the earthquake. My data markers reflects the magnitude of the earthquake by their size and the depth of the earthquake by color. Earthquakes with higher magnitudes appear larger and are red or orange red, and earthquakes with greater depth are darker in color. If a particular circle is clicked it displays the location, date and time of earthquake, and the magnitude of each earthquake.
Tools Used
JavaScript
Api-interactions
Leaflet
GeoJSON
HTML
CSS