


Project Overview
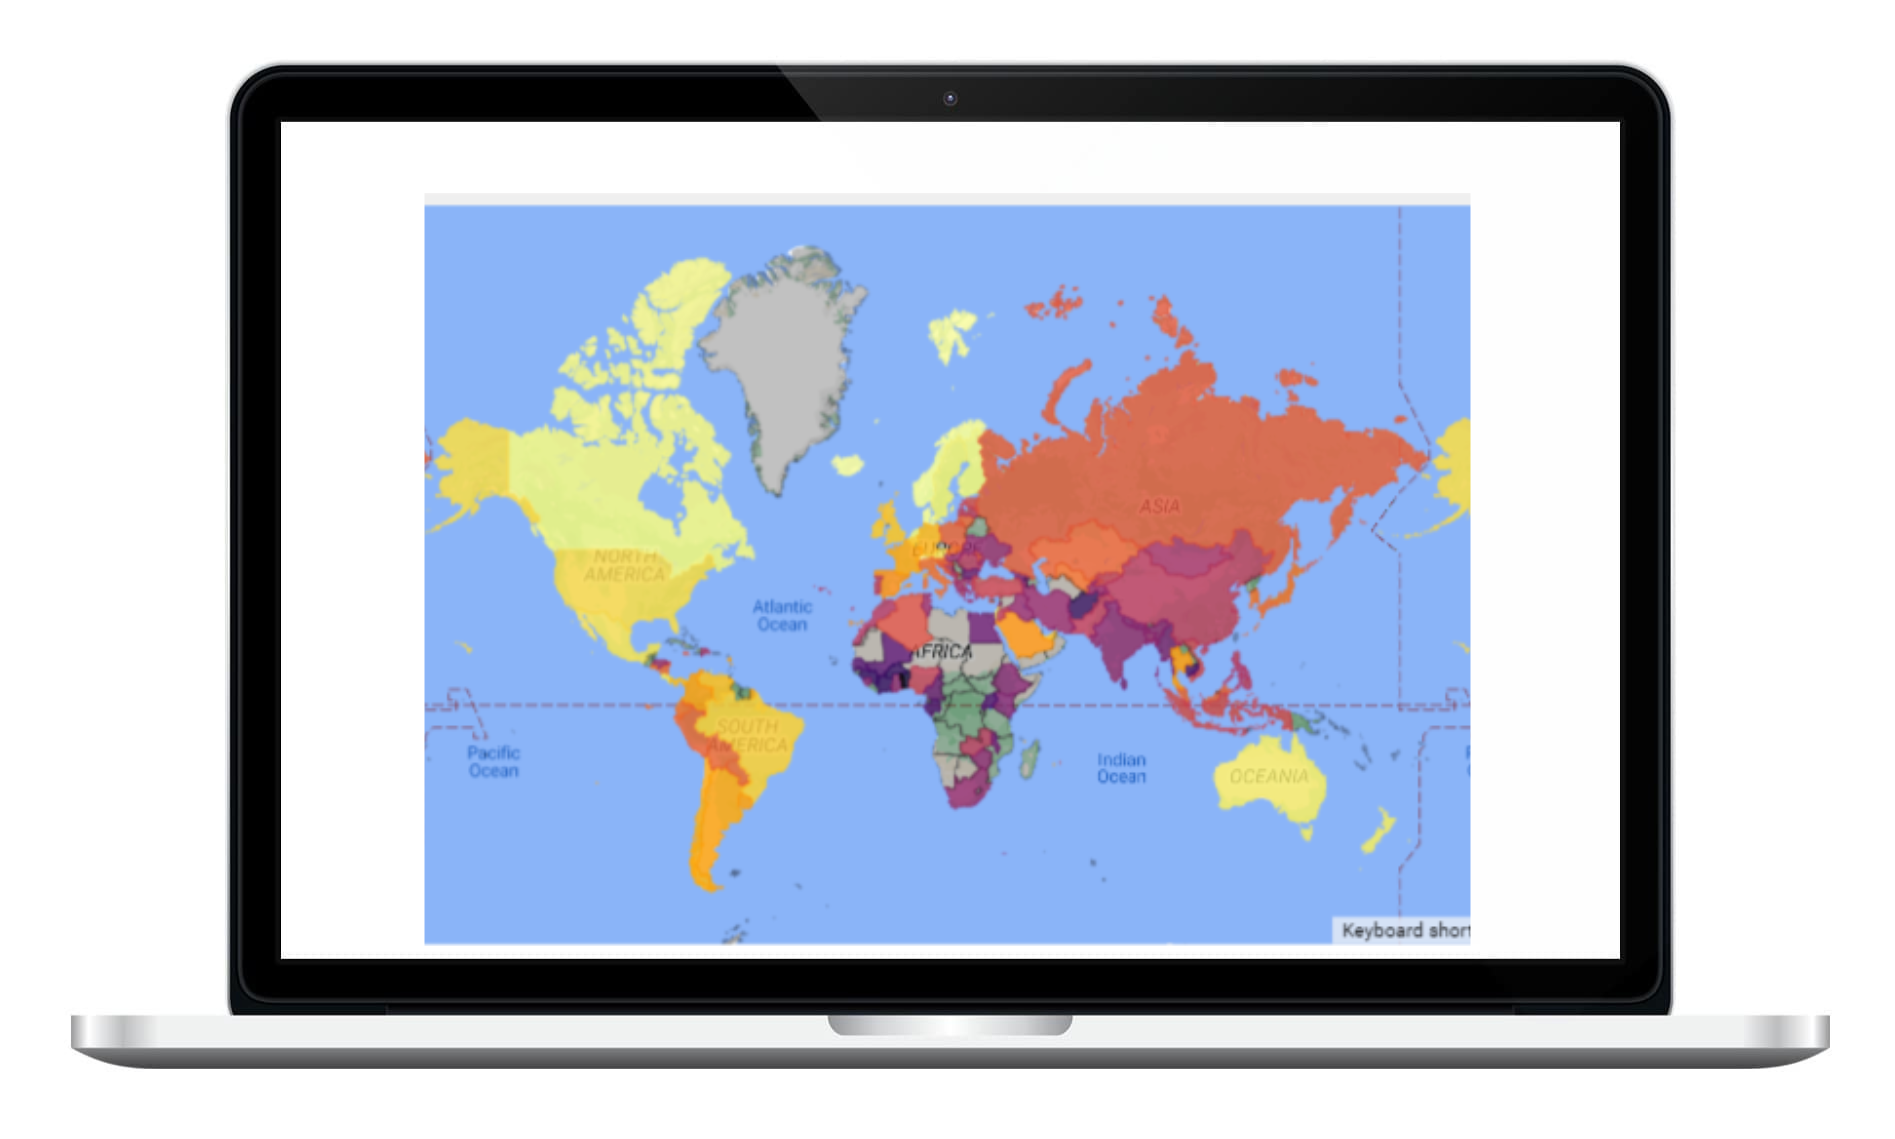
We utilized GMaps to create a choropleth map that observes happiness over time. Generally, all countries represented in our dataset have declined in happiness, shown by a country's color getting darker over time. A marked difference in color was observed in 2020, likely attributable to the COVID-10 pandemic. A notable country to observe on the map is Canada, whose rank dropped from the top five to below 10 over our time frame (2015-2022).We also created a line plot of average happiness over time. Interestingly, although the general impression from the choropleth map is that countries get less happy over time, an analysis of average happiness shows that world happiness actually increases over time, with only a slight decline recently in 2021. Specifically, average happiness rose from 5.525 in 2015 to 5.675 in 2020 and continued to rise to 5.700 in 2021. It has since declined to 5.675 this year.
Our Study Questions:
Question 1:Are countries with higher average incomes happier?
There is a strong positive correlation between average income and happiness (r-square value of 0.698): as income rises, happiness scores increase from close to 3 points to between 7 and 8 points. The top five highest average income countries (Switzerland, The USA, Norway, Canada, and Australia) all had happiness scores close to or above 7 points. The countries with the lowest average income (Togo, Mozambique, Mali, Uzbekistan, and Malawi) generally all had scores between 4 and 5 points, with the exception of Uzbekistan whose happiness score was closer to 6 points. Outside factors potentially impacting average income and leading to Uzbekistan as an exception could be economic growth, inflation, population growth, etc.
Question 2: Does the weather of a country (avg. sunshine) influence happiness?
There is a weak negative correlation between average sunshine hours per year and happiness (r-square value of 0.294): as the number of sunshine hours per year increases, happiness scores appear to decrease. This relationship is supported in our bar plot showing the happiness scores of the top five sunniest countries (Namibia, Egypt, Cyprus, Israel, and Algeria) vs. the top five least sunny countries (Belgium, United Kingdom, Ireland, Norway, and Iceland). The least sunny countries all had happiness scores between 7 and 8 points. Three out of the top five sunniest countries had happiness scores below average happiness, while the remaining two were just slightly above. Outside factors potentially impacting a country's weather and leading to our two exception countries could be cloudiness, humidity, rainfall, temperature, etc.
Question 3: Are countries with longer life expectancies happier?
There is a positive correlation between average life expectancy and happiness (r-square value of 0.608): as life expectancy increases, happiness scores generally increase. This relationship is also visible in our bar chart showing the top five countries with the highest life expectancy (Japan, Korea, Switzerland, Cyprus, and Israel) and the bottom five countries with the lowest life expectancy (Zambia, Nigeria, Guinea, Zimbabwe, and Mozambique). The countries with the highest life expectancy all scored above average happiness, between 6 and 7.5 points. The countries with the lowest life expectancy scores all scored well below average happiness, between 3 and 5 points. Outside factors potentially impacting a country's average life expectancy and that may explain some of the variation in our scatter plot is country population, pollution levels, access to healthcare, violence rates, and war.
Question 4: Does alcohol consumption influence happiness?
There is a very weak positive correlation between alcohol consumption per year and happiness score (r-square value of 0.309): it is hard to say that as alcohol consumption increases, happiness also increases. There is a general upward trend in happiness scores for countries that reported higher alcohol consumption per year, however, there is significant variation. In our bar plot, we compared the happiness scores of the heaviest drinking countries (Latvia, Moldova, Germany, Lithuania, and Ireland) to the least heavy drinking countries (Morocco, Iraq, Pakistan, Egypt, and Bangladesh. While the bar plot shows that all heavy drinking countries are above average happiness and all least heavy drinking countries are below average happiness, there are outside factors that may impact a country's average alcohol consumption not considered in our dataset, including religious reasons or society acceptance.
Conclusions + Analysis Limitations:
In reviewing the four happiness indicators we selected, average income and life expectancy had the highest r-square values (and thus the least varition with happiness), indicating the strongest relationship with happiness. Between average income and life expectancy, average income had the highest r-square and the least variation, thus we would conclude that, of the happiness indicators we selected, average income is the best indicator of happiness. However, one limitation of our analysis is that without the ability to conduct a multiple regression, we were not able to statistically prove that average income is the best indicator of happiness. Thus, we relied on r-square values to come to our final conclusion.
Additional limitations of our analysis:
The World Happiness Report dataset only comes from countries willing to participate.
We were unable to code the GMaps to to be interactive to cycle through the years.
In our attempt to compare happiness to weather, it was difficult to find a complete historical dataset to incorporate all weather factors that can affect mood (rainfall, cloudiness, temperature (historical weather APIs cost money), etc.)
Lack of datasets that could look further into the impact of corruption.
Lack of datasets having the same variables to further make comparisons: (ex. Male vs. Female)
Further Considerations:
Research other happiness indicators: Job satisfaction, Population density, Rural vs. Urban living, Loneliness, Disease burden, Education level , Type of Government.
Compare: Cost of living to happiness; Healthy habits to life expectancy, then to happiness; Other weather factors to happiness, Social drinking vs. Problem drinking to happiness.
Datasets Used:
World happiness dataset 2022: https://www.kaggle.com/datasets/ajaypalsinghlo/world-happiness-report-2022
World happiness dataset 2015-2022: https://www.kaggle.com/datasets/mathurinache/world-happiness-report?select=2017.csv
Median Income by Country: https://worldpopulationreview.com/country-rankings/median-income-by-country
Sunshine Hours: https://www.kaggle.com/datasets/prasertk/sunshine-duration-by-city
Alcohol Consumption by Country: https://worldpopulationreview.com/country-rankings/alcohol-consumption-by-country